TON Price Analysis: The $1.20 Support Holds Firm Amidst Bearish Pressures – What's Next for Traders?
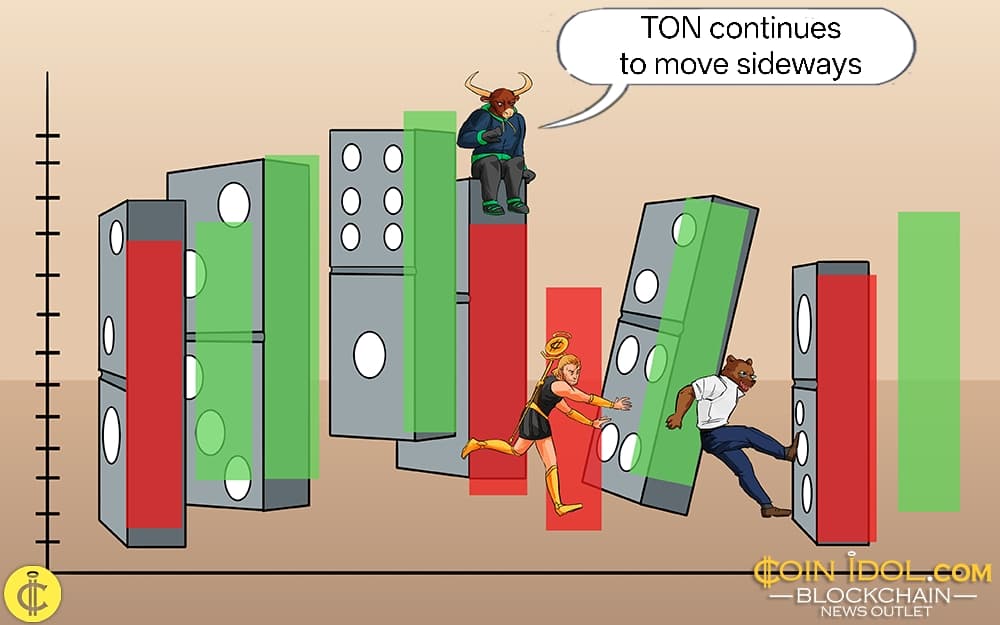
In the dynamic and often volatile world of cryptocurrency, identifying crucial support and resistance levels is paramount for informed trading decisions. Currently, all eyes in The Open Network (TON) community and among active traders are fixed on the $1.20 mark. This price level has emerged as a significant battleground for bulls and bears, with TON showing impressive fortitude by consistently staying above it, even as the broader market faces downward pressure.
TON's Resilience: A Deep Dive into the $1.20 Support
The Open Network (TON) has carved out a unique niche in the blockchain space, known for its high transaction speeds and scalability, largely due to its association with the Telegram messaging app. This underlying utility often contributes to its market interest. However, like all digital assets, TON is not immune to market-wide sentiment and technical patterns.
The Criticality of the $1.20 Level
The $1.20 price point for TON is far more than just a number; it represents a confluence of technical and psychological factors that make it a 'critical support.' From a technical analysis perspective, a critical support level is typically a price where buying interest has historically been strong enough to halt further declines, often acting as a springboard for potential reversals. For TON, this level appears to be a significant accumulation zone for buyers, preventing a deeper capitulation.
- Historical Significance: This price often aligns with previous periods of consolidation or bounce-backs, indicating a strong historical demand zone.
- Psychological Barrier: Round numbers or significant price levels often act as psychological anchors for traders, influencing their buy and sell decisions.
- Last Line of Defense: For many, a break below such a critical support can signal a shift in market structure towards a more pronounced bearish trend.
Navigating Bearish Headwinds and Immediate Resistance Targets
While TON has shown admirable strength at $1.20, it's crucial to acknowledge the prevailing bearish sentiment that has gripped much of the cryptocurrency market. This broader pressure means that even a strong support hold might not immediately translate into a sustained rally without significant buying volume and a shift in overall market dynamics.
Key Resistance Levels for TON Traders
Should TON successfully maintain its position above $1.20 and gather bullish momentum, traders will immediately look towards key resistance levels where selling pressure is expected to increase. These levels typically represent previous areas of supply or where sellers have historically taken control.
- $1.40 Resistance: This is the immediate hurdle for TON. A clear break and sustained trade above this level would signal a short-term bullish shift, potentially attracting more buyers.
- $1.60 Resistance: Beyond $1.40, the $1.60 mark stands as the next significant resistance. Overcoming this level would suggest a more substantial recovery, potentially invalidating some of the short-term bearish arguments.
Additionally, dynamic resistance levels, such as key moving averages (e.g., the 50-day or 100-day Exponential Moving Average), often converge near these static resistance zones, adding to their significance. A 'death cross' formation, where a shorter-term moving average crosses below a longer-term one, can also signal strong bearish momentum and act as a significant overhead resistance.
Potential Scenarios for TON Traders: A Forward Outlook
For active traders, understanding the potential future price movements based on current technical setups is vital. Here are two primary scenarios for TON:
Scenario 1: The Bullish Rebound – Holding the Line at $1.20
If TON continues to hold the $1.20 support, it could signal a period of accumulation and a potential bullish reversal. Traders would look for confirmation signals such as increased buying volume, bullish candlestick patterns (e.g., hammer, bullish engulfing), or a positive divergence on momentum indicators.
- Entry Strategy: Consider long positions with tight stop-losses placed just below the $1.20 mark (e.g., $1.15-$1.18) to manage risk effectively.
- Profit Targets: Initial targets would be the resistance levels at $1.40, followed by $1.60. Partial profit-taking at these levels can be a prudent strategy.
- Confirmation: A daily close consistently above $1.20, especially with rising volume, would strengthen this scenario.
Scenario 2: The Bearish Breakdown – A Fall Below $1.20
Conversely, if the bearish pressure intensifies and TON fails to hold the $1.20 support, a significant downside move could ensue. A clear breakdown, especially on high volume, would likely trigger further selling and potentially lead to cascading liquidations.
- Next Support Levels: The immediate downside targets would be the $1.00 psychological level, followed by the stronger support zone around $0.80. These levels would then become the new focus for potential bounce plays.
- Trading Opportunity: A confirmed breakdown below $1.20 could present short-selling opportunities for risk-tolerant traders, with stop-losses placed above the broken support (now resistance).
- Risk Management: For existing long positions, a close below $1.20 should be a strong signal to re-evaluate and potentially exit to mitigate further losses.
Technical Indicators Offering Further Clues
Beyond simple price action and support/resistance, traders should monitor a suite of technical indicators for additional insights:
- Relative Strength Index (RSI): Watch for the RSI to move out of oversold territory (if applicable) or for bullish divergences, which could signal a potential upward reversal.
- Volume Profile: Significant volume accompanying a breakout above resistance or a breakdown below support adds credibility to the move. Low volume moves are often less reliable.
- Moving Averages (MAs): Observe the positioning of short-term MAs relative to longer-term MAs. A 'golden cross' (short-term MA crossing above long-term MA) can signal bullish momentum, while a 'death cross' indicates bearish sentiment.
- Bollinger Bands: Narrowing bands often precede a significant price move, while price action at the upper or lower bands can indicate overbought or oversold conditions.
The Broader Crypto Market's Influence
It's vital to remember that TON, like most altcoins, is often influenced by the performance of Bitcoin (BTC). A significant move in BTC, either up or down, can have a ripple effect across the entire crypto market. Traders should always keep an eye on BTC's price action and broader macroeconomic factors that could impact investor sentiment.
Conclusion: A Watchful Eye on TON's Next Move
TON's ability to hold above the $1.20 critical support level is a testament to its underlying strength and demand, even in a challenging market. However, this level remains a crucial inflection point. Traders must remain vigilant, monitoring price action, volume, and key technical indicators to anticipate TON's next significant move. Whether it’s a robust rebound towards $1.40 and $1.60 or a breakdown towards $1.00 and $0.80, careful analysis and disciplined risk management will be key to navigating The Open Network's evolving price trajectory.
Source: coinidol.com
Ready to Trade Smarter?
Join thousands of traders using AI-powered signals, real-time analytics, and on-chain intelligence to stay ahead of the market.
Start Free — No Credit Card Needed