Dogecoin at a Critical Juncture: Will DOGE Break Out from This Historic Trendline?
Dogecoin at a Critical Juncture: Will DOGE Break Out from This Historic Trendline?
Dogecoin (DOGE), the quintessential meme coin, is once again capturing the attention of the crypto market. After a period of consolidation, DOGE has returned to a crucial historic trendline that has often acted as a springboard for its most memorable rallies. For traders utilizing platforms like NexCrypto, understanding the implications of this retest is paramount to navigating potential opportunities and risks.
The Significance of the Historic Trendline
For months, if not longer, Dogecoin's price action has been interacting with a specific, descending resistance trendline. This line isn't merely a technical drawing; it represents a significant psychological and supply zone for DOGE. Historically, touches or breaches of this trendline have often preceded periods of heightened volatility, sometimes leading to substantial upward movements. Its repeated retests suggest an ongoing battle between bullish accumulation and bearish pressure.
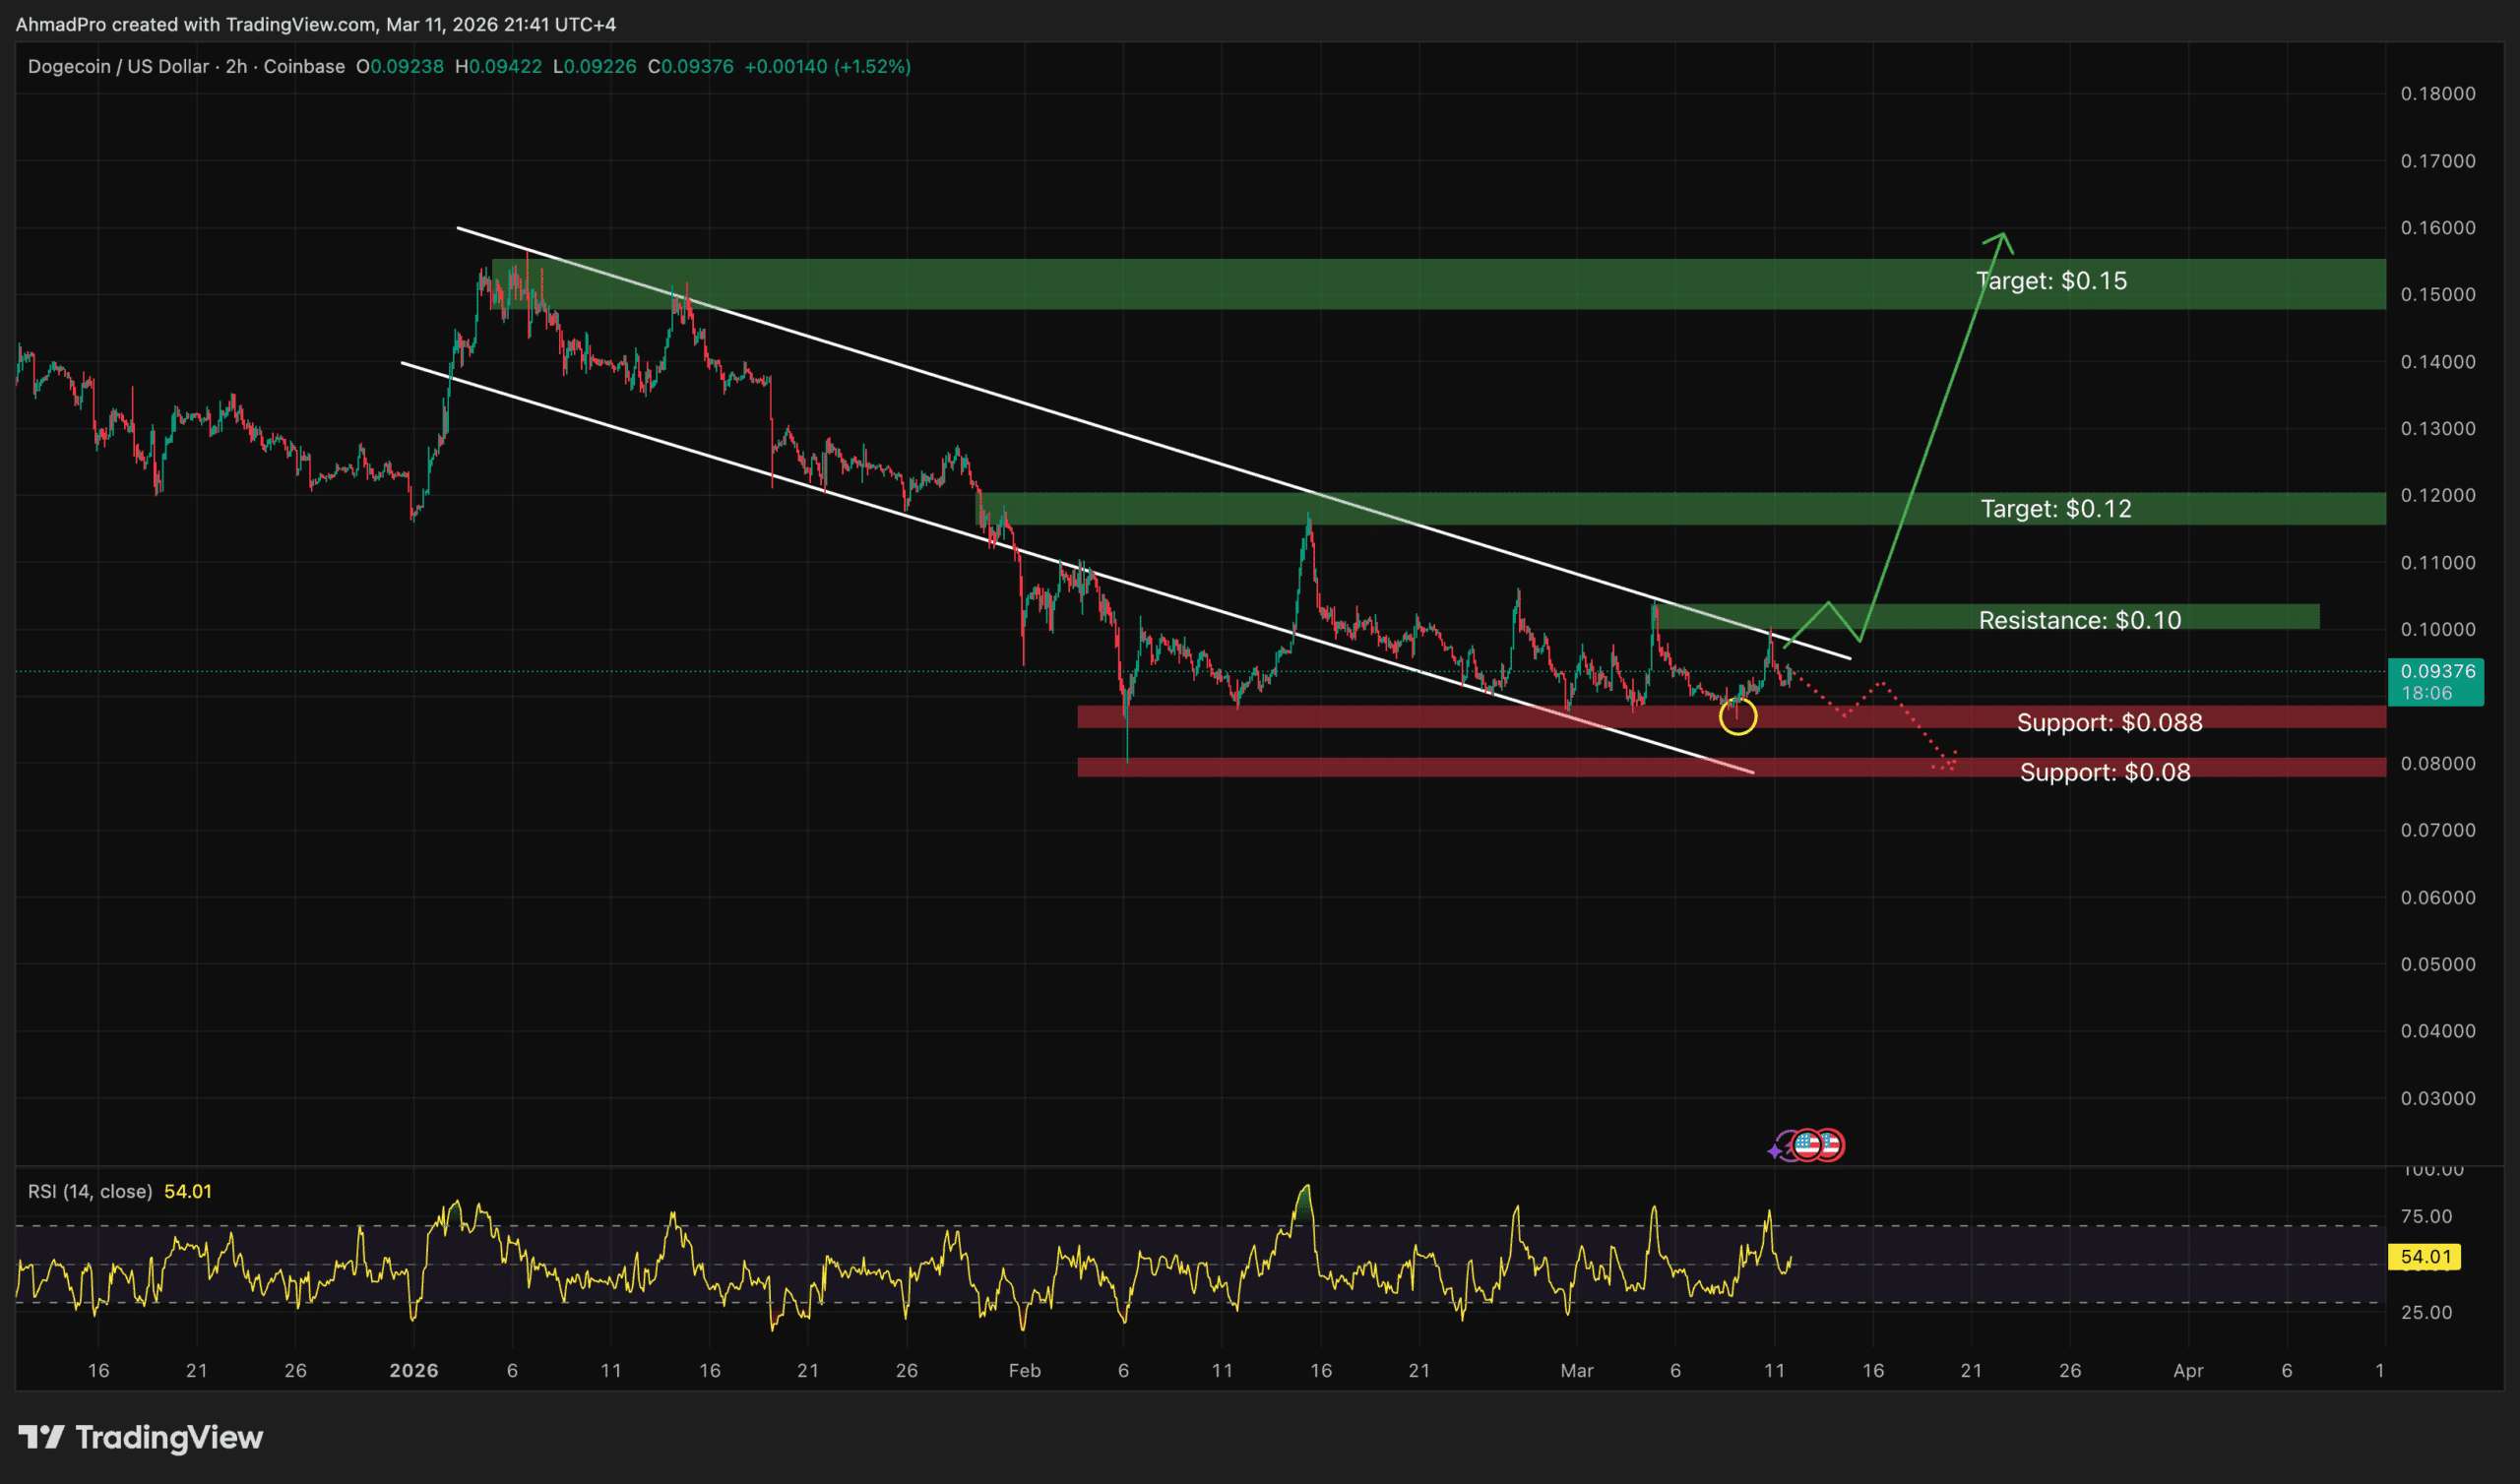
Currently, DOGE is testing this very trendline, forming what many analysts identify as a symmetrical triangle pattern when viewed in conjunction with a horizontal support level. Symmetrical triangles are continuation patterns that suggest a period of indecision before a decisive move in either direction. The longer the consolidation within this triangle, the more significant the potential breakout.
Key Price Levels and Technical Indicators
Support at $0.085: The Bull's Last Stand?
The immediate and most critical support level for Dogecoin sits around the $0.085 mark. This horizontal support has proven resilient in recent weeks, preventing deeper pullbacks. Holding this level is crucial for bullish sentiment. A sustained break below $0.085 could invalidate the current consolidation pattern and potentially lead to a retest of lower support zones, possibly towards $0.080 or even $0.075, triggering stop-losses and increasing selling pressure.
Resistance at $0.095 - $0.10: The Breakout Barrier
On the upside, Dogecoin faces significant resistance near the $0.095-$0.10 range. The $0.10 level, in particular, acts as a strong psychological barrier in addition to technical resistance. A decisive break and close above this resistance, especially with increased trading volume, would be a strong bullish signal. Such a move could confirm a breakout from the symmetrical triangle and potentially pave the way for a rally towards:
- First target: $0.11 - $0.12
- Second target: $0.15 and beyond, depending on market momentum.
Analyzing the Technical Oscillators:
To gain a clearer picture, let's examine some key technical indicators:
- Relative Strength Index (RSI): The RSI has been hovering around the neutral 50-mark, occasionally dipping into oversold territory before bouncing back. This suggests a lack of strong directional momentum but also indicates that DOGE isn't currently overbought, leaving room for an upward move. A push above 60-70 would signal increasing bullish momentum.
- Moving Average Convergence Divergence (MACD): The MACD line has recently shown a bearish crossover below the signal line, indicating short-term bearish momentum or continued consolidation. For a bullish reversal, traders will be looking for a bullish crossover, where the MACD line crosses back above the signal line.
- Trading Volume: Volume has been relatively subdued during this consolidation phase. A significant spike in buying volume accompanying a price breakout above the trendline and $0.095 resistance would add strong credibility to the bullish scenario. Conversely, a high-volume breakdown below $0.085 would confirm bearish pressure.
Potential Scenarios for NexCrypto Traders
Given Dogecoin's current position, traders should prepare for two primary scenarios:
1. The Bullish Breakout:
If DOGE successfully breaks above the descending trendline and the $0.095-$0.10 resistance zone with strong volume, it could trigger a rapid upward movement. NexCrypto signal users might look for confirmation signals like a daily close above $0.10, followed by sustained buying pressure. Entry points could be strategically planned above the breakout level, with stop-losses placed below the newly formed support or the $0.085 level to manage risk.
2. The Bearish Breakdown:
Should the $0.085 support fail, especially with increasing selling volume, DOGE could experience a significant pullback. Traders might consider short positions or avoid long entries until a clear bottom is established. Stop-losses for existing long positions would be crucial in this scenario to prevent larger losses. The next significant support levels would be $0.080 and potentially $0.075.
Broader Market Context and Conclusion
It's important to remember that Dogecoin, like most altcoins, is heavily influenced by Bitcoin's price action and overall market sentiment. A strong Bitcoin rally or a broader altcoin season could provide the necessary tailwinds for DOGE to break out. Conversely, a market-wide correction could exacerbate a bearish breakdown.
Dogecoin is undeniably at a crossroads. The retest of its historic trendline within a symmetrical triangle pattern sets the stage for a potentially significant move. NexCrypto traders should monitor the $0.085 support and $0.095-$0.10 resistance levels closely, combining technical analysis with broader market sentiment. Patience, confirmation, and stringent risk management will be key to capitalizing on DOGE's next direction.
Source: 99Bitcoins
Ready to Trade Smarter?
Join thousands of traders using AI-powered signals, real-time analytics, and on-chain intelligence to stay ahead of the market.
Start Free — No Credit Card Needed