Cardano (ADA) on the Brink? Bollinger Bands Signal Imminent Volatility Spike
Cardano (ADA): A Coiled Spring Awaiting Release
Cardano (ADA) has long been a staple in many cryptocurrency portfolios, known for its robust peer-reviewed research and methodical development approach. However, recent price action has seen ADA enter a period of notable consolidation, characterized by reduced volatility. For astute traders and technical analysts, this quiet period isn't a sign of stagnation, but rather a potential precursor to a significant price event. The tightening of its Bollinger Bands suggests that ADA could be a coiled spring, ready for an explosive move in either direction.
In the dynamic world of crypto trading, identifying such patterns early can provide a crucial edge. NexCrypto blog delves into what this Bollinger Band squeeze means for Cardano's immediate future and how traders can prepare for the potential volatility ahead.
Decoding the Bollinger Bands Phenomenon
Before we dive into Cardano's specific situation, it's essential to grasp the utility of Bollinger Bands. Developed by John Bollinger, this technical analysis tool consists of a simple moving average (typically 20-period) flanked by two standard deviation lines, an upper band and a lower band.
- The Middle Band: Usually a 20-period Simple Moving Average (SMA), representing the asset's 'typical' price over that period.
- The Upper Band: Two standard deviations above the SMA, acting as a dynamic resistance level.
- The Lower Band: Two standard deviations below the SMA, serving as a dynamic support level.
The Bollinger Band Squeeze: A Signal of Impending Action
The core concept relevant to ADA's current state is the 'Bollinger Band Squeeze.' This occurs when the upper and lower bands contract and move closer to the middle band. A squeeze indicates a period of unusually low volatility, where the price is trading within a very narrow range. Historically, periods of low volatility are often followed by periods of high volatility. In essence, a squeeze signals that a significant price movement – a breakout or a breakdown – is imminent, though it doesn't predict the direction.
Cardano's Current Technical Landscape: A Deep Dive into ADA's Squeeze
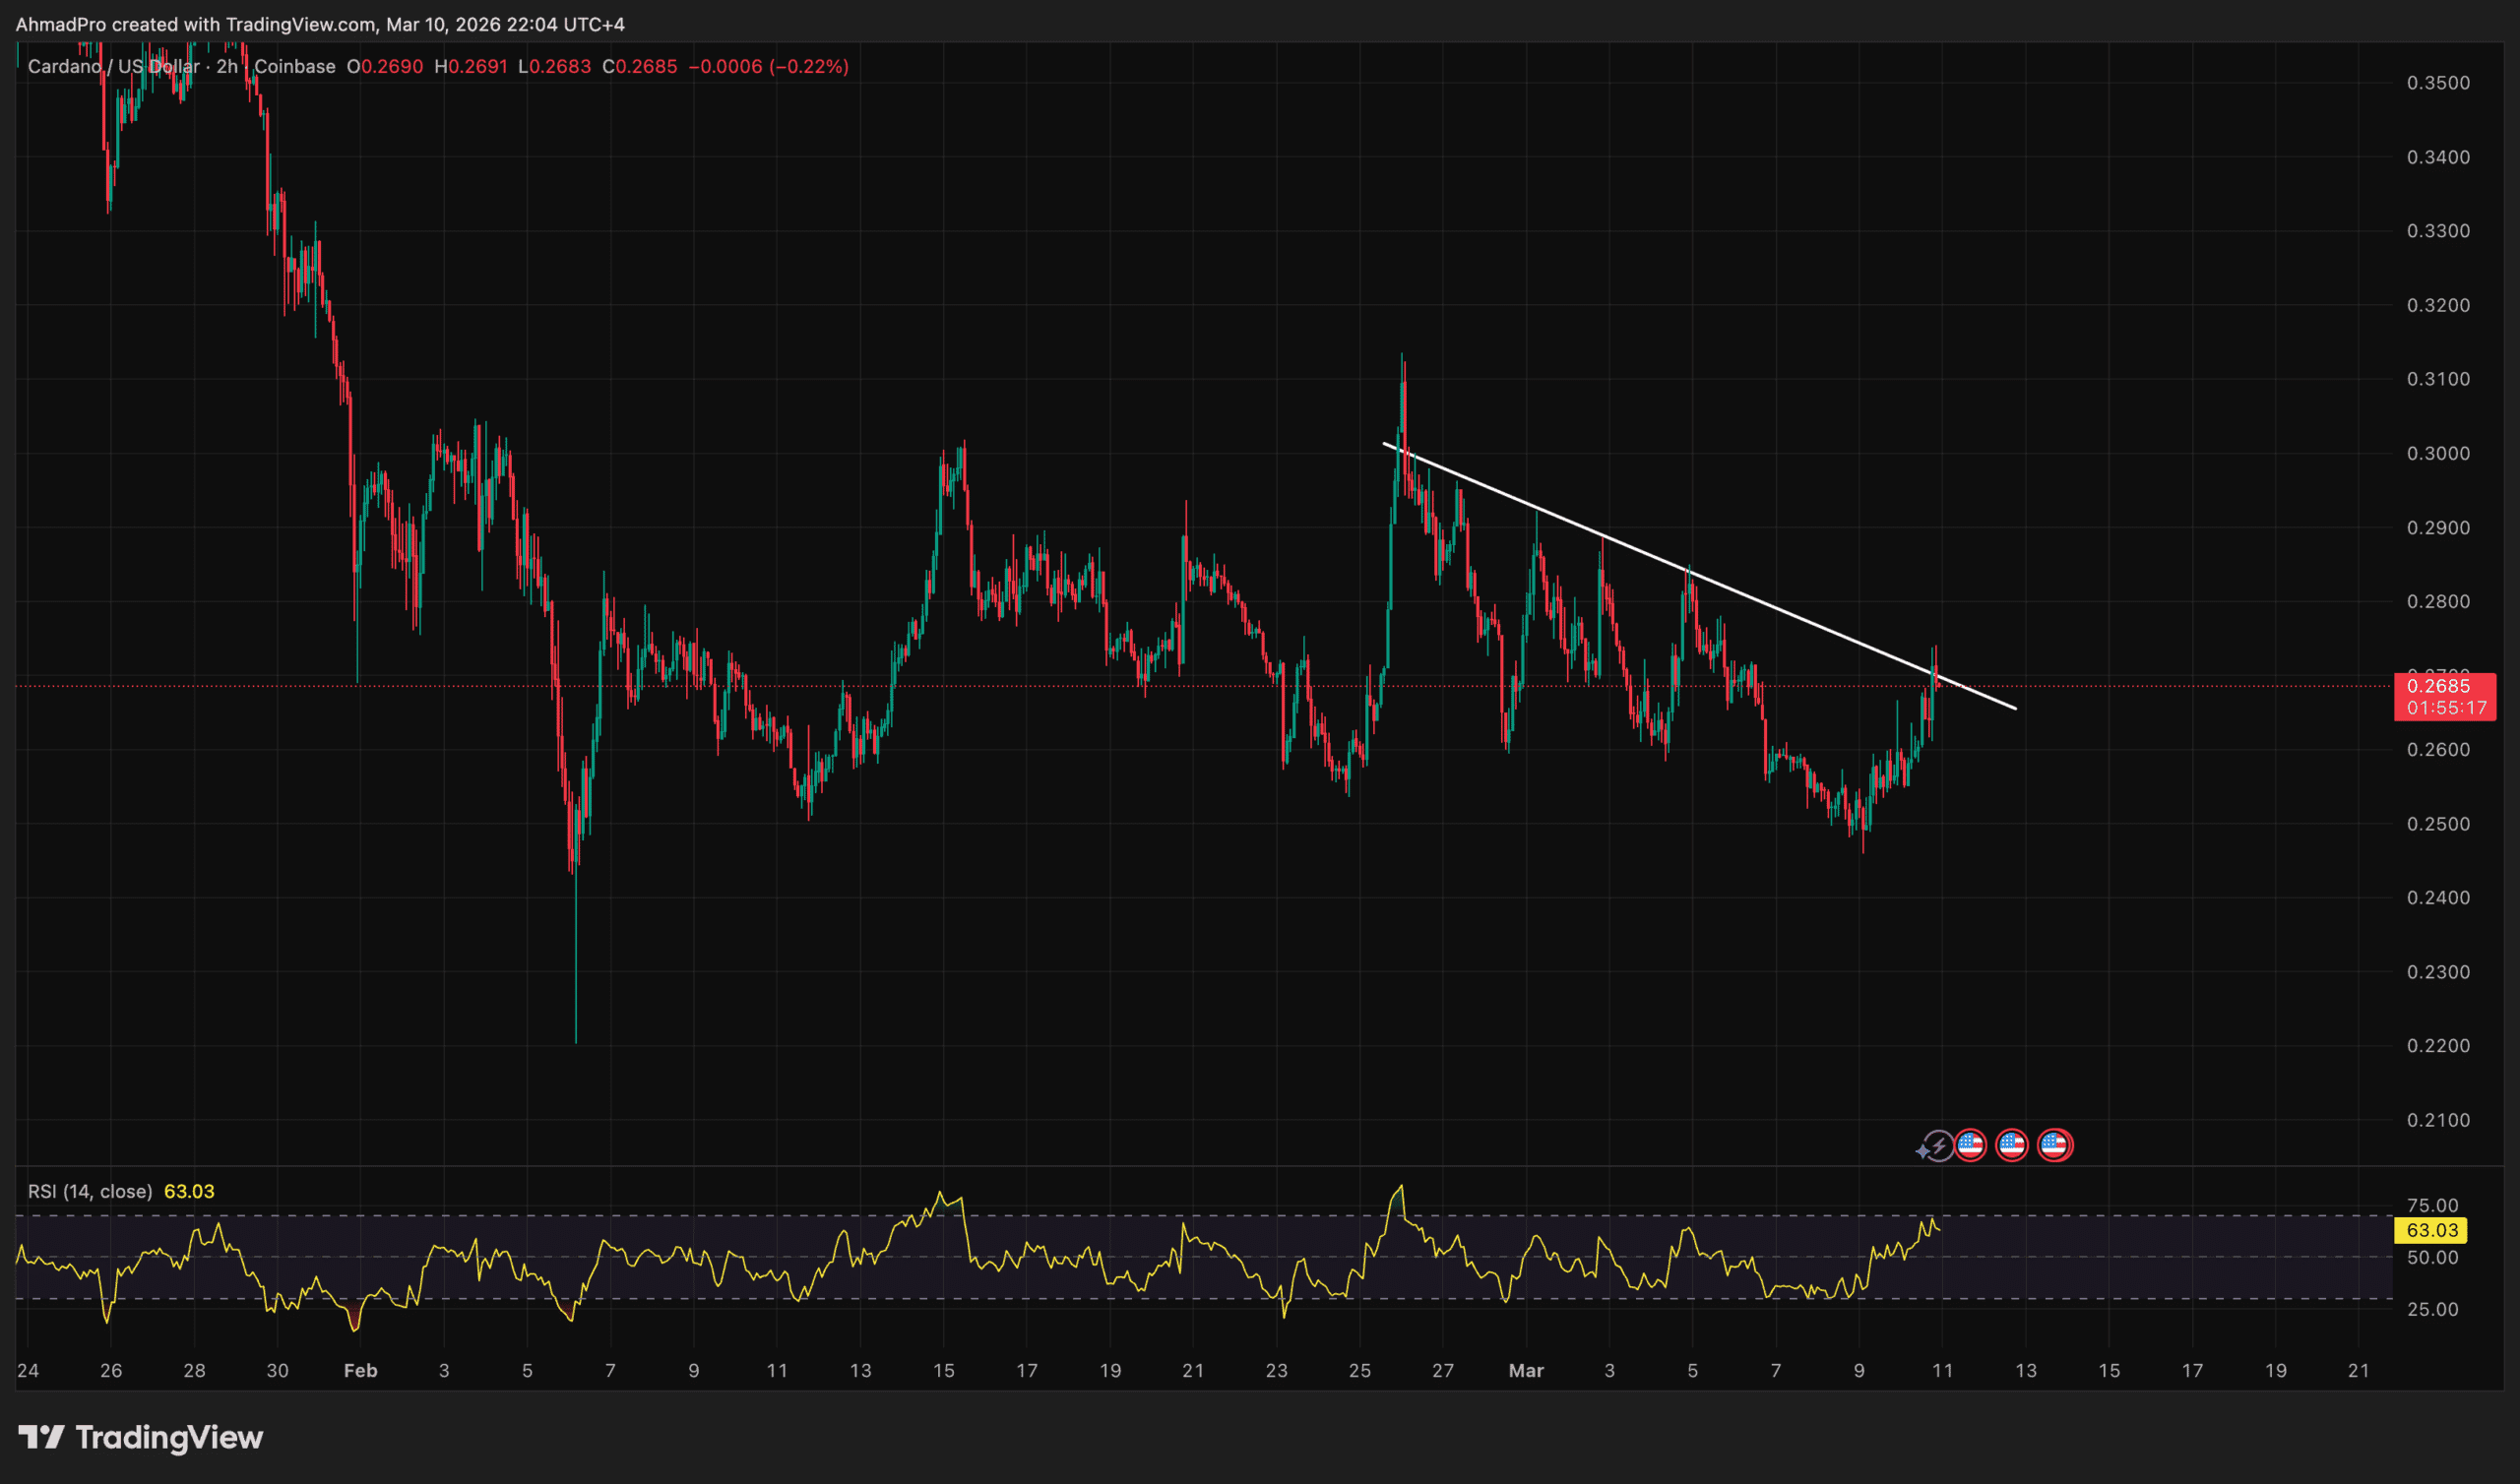
Examining Cardano's daily chart reveals a compelling narrative. Over the past few weeks, the Bollinger Bands around ADA's price action have been tightening considerably. The distance between the upper and lower bands has narrowed to levels not seen in some time, signifying a dramatic reduction in price fluctuation. This sustained period of compression suggests that market participants are consolidating, waiting for a catalyst or a clear directional signal before committing to larger moves.
This squeeze is particularly significant because it reflects a build-up of energy. When the bands are wide, volatility is high. When they contract, it's like compressing a spring – the potential energy for a sharp move increases dramatically. For ADA, this means that the current calm is likely the calm before a storm, presenting both opportunities and risks for traders.
Navigating the Potential Breakout: Bullish vs. Bearish Scenarios
While a Bollinger Band squeeze indicates an impending move, it does not specify the direction. Traders must be prepared for both bullish and bearish outcomes.
The Bullish Path for ADA
Should ADA break out to the upside, we would expect to see a strong surge in buying pressure, pushing the price above the upper Bollinger Band, accompanied by significant trading volume. Potential catalysts could include positive news regarding Hydra scaling, new partnerships, or a broader bullish sentiment across the crypto market. Key resistance levels from previous highs would become immediate targets, with a sustained move potentially leading to a retest of higher price points.
The Bearish Path for ADA
Conversely, a breakdown below the lower Bollinger Band, also backed by substantial volume, would signal a bearish turn. This could be triggered by negative market sentiment, project delays, or broader macroeconomic headwinds. In such a scenario, previous support levels would come into play, and a continued downtrend could see ADA testing lower price floors. Traders should identify critical support zones to manage risk effectively.
Confirming the Move: Beyond Bollinger Bands
While Bollinger Bands are powerful, they are most effective when used in conjunction with other technical indicators. To confirm a potential breakout or breakdown, traders should monitor:
- Volume: A legitimate breakout (or breakdown) should be accompanied by a significant increase in trading volume. Low volume on a price move often indicates a false signal.
- Relative Strength Index (RSI): Look for divergence or confirmation of momentum. An RSI moving into overbought territory on a bullish breakout, or oversold on a bearish breakdown, can add conviction.
- Moving Average Convergence Divergence (MACD): Crossovers on the MACD histogram or signal lines can provide additional confirmation of momentum shifts.
- Key Support and Resistance Levels: Identify historical price points where ADA has previously found support or faced resistance. A break above or below these levels with conviction is a strong signal.
- Market Sentiment and News: Keep an eye on broader crypto market trends and any Cardano-specific news that could act as a catalyst.
Strategic Considerations for Traders
For traders seeking to capitalize on ADA's potential volatility, careful planning and risk management are paramount:
- Patience is Key: Wait for a clear breakout or breakdown confirmation. Entering a trade too early based solely on a squeeze can lead to whipsaws.
- Set Stop-Loss Orders: Regardless of the direction you anticipate, always implement stop-loss orders to limit potential losses if the market moves against your position.
- Consider Position Sizing: Adjust your position size based on your risk tolerance and the perceived volatility.
- Monitor Multiple Timeframes: While the daily chart shows the squeeze, examining shorter timeframes (e.g., 4-hour) can provide earlier entry/exit signals once the move begins.
Conclusion: Be Prepared for ADA's Next Chapter
Cardano's ADA token is currently at a critical juncture, with its Bollinger Bands signaling an impending burst of volatility. This period of consolidation offers a prime opportunity for traders to position themselves for what could be a significant price movement. By understanding the mechanics of a Bollinger Band squeeze and integrating it with other technical analysis tools and robust risk management strategies, traders can navigate the upcoming volatility with greater confidence. Stay vigilant, stay informed, and prepare for ADA's next chapter.
Source: 99Bitcoins
Ready to Trade Smarter?
Join thousands of traders using AI-powered signals, real-time analytics, and on-chain intelligence to stay ahead of the market.
Start Free — No Credit Card Needed