Bitcoin's Silent Squeeze: Bollinger Bands Signal Impending Volatility Wave
Bitcoin's Silent Squeeze: Bollinger Bands Signal Impending Volatility Wave
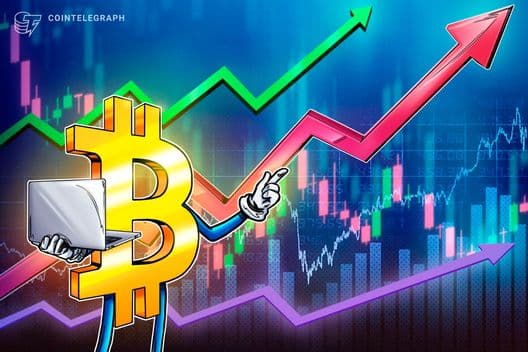
The cryptocurrency market is a perpetual motion machine, but even its most volatile asset, Bitcoin (BTC), experiences periods of relative calm. However, these periods of tranquility are rarely permanent. Savvy traders know that low volatility often precedes high volatility, and right now, a classic technical indicator is flashing a strong signal that a major move for Bitcoin is on the horizon: the tightening of its Bollinger Bands.
Understanding Bollinger Bands: Your Volatility Gauge
Before diving into what this means for Bitcoin, let's briefly recap what Bollinger Bands are. Developed by John Bollinger, this technical analysis tool consists of three lines:
- The Middle Band: Typically a 20-period Simple Moving Average (SMA).
- The Upper Band: Two standard deviations above the SMA.
- The Lower Band: Two standard deviations below the SMA.
The core concept is that price tends to stay within these bands. The width of the bands directly reflects market volatility. When the bands are wide, volatility is high; when they contract or 'squeeze' together, volatility is low. A squeeze indicates that price has been consolidating in a narrow range, often building energy for a significant directional move.
The Bitcoin Squeeze: A Precursor to Action
Currently, Bitcoin's daily and weekly charts are showing a notable contraction in its Bollinger Bands. This 'squeeze' is a strong indication that the market is in a period of consolidation, with neither buyers nor sellers able to decisively push the price in a sustained direction. Historically, such periods of low volatility in Bitcoin have often been the calm before the storm, preceding explosive price action.
This isn't just theoretical; Bitcoin's price history is replete with examples where tight Bollinger Bands were followed by substantial breakouts or breakdowns. The longer and tighter the squeeze, the more powerful the subsequent move tends to be. For traders, this translates into a period of heightened alert, as the market is likely to transition from its current sideways grind to a more dynamic phase.
Navigating the Impending Volatility: Potential Scenarios
While Bollinger Bands signal an impending move, they don't inherently predict the direction. Therefore, traders must prepare for both bullish and bearish scenarios:
1. The Bullish Breakout
If Bitcoin's price breaks above the upper Bollinger Band with conviction, especially accompanied by significant trading volume, it could signal the start of a new uptrend. A strong breakout would likely invalidate previous resistance levels and could lead to rapid price appreciation. Traders might look for confirmation from other momentum indicators, such as the Relative Strength Index (RSI) moving into overbought territory or a bullish crossover on the MACD.
2. The Bearish Breakdown
Conversely, a decisive break below the lower Bollinger Band, again with robust volume, would suggest a bearish breakdown. This could lead to a swift decline in price as support levels fail. In this scenario, traders would watch for bearish signals on momentum indicators, like the RSI entering oversold territory or a bearish MACD crossover, confirming the downward momentum.
Strategic Considerations for NexCrypto Traders
For those utilizing crypto trading signals, understanding the Bollinger Band squeeze offers a crucial layer of context for upcoming alerts:
- Patience is Key: Resist the urge to enter trades prematurely. Wait for a confirmed break above or below the bands.
- Volume Confirmation: Always seek volume confirmation for any breakout or breakdown. A move without significant volume can often be a false signal.
- Set Alerts: Configure price alerts at the upper and lower Bollinger Bands to be notified immediately when a potential move begins.
- Risk Management: Given the potential for a powerful move in either direction, strict risk management is paramount. Implement stop-loss orders to protect capital in case the market moves against your position.
- Look for Confluence: While Bollinger Bands are powerful, combine their signals with other technical indicators (e.g., support/resistance levels, moving averages, candlestick patterns) for higher-probability trades.
- Consider Market Structure: Analyze the broader market structure. Is Bitcoin in an overall uptrend, downtrend, or range? This context can help bias your directional expectations.
Beyond the Bands: A Holistic View
While the Bollinger Band squeeze is a compelling signal, it's vital to remember that no single indicator tells the whole story. Traders should also monitor fundamental developments, macroeconomic factors, and overall market sentiment. Bitcoin's halving event in April 2024, for instance, adds another layer of complexity and potential catalysts to its price trajectory.
Conclusion: Prepare for Action
The tightening Bollinger Bands on Bitcoin's chart serve as a clear warning: a significant price movement is brewing. For traders leveraging signals, this period demands heightened vigilance and preparation. By understanding what the Bollinger Band squeeze implies and implementing sound trading strategies, you can position yourself to potentially capitalize on Bitcoin's next major volatility wave, regardless of its direction. Stay sharp, stay informed, and trade wisely with NexCrypto.
Source: CoinTelegraph
Ready to Trade Smarter?
Join thousands of traders using AI-powered signals, real-time analytics, and on-chain intelligence to stay ahead of the market.
Start Free — No Credit Card Needed